Data Science Technique

Advance Data Science Techniques-Series 2: Dimensionality Reduction Techniques

Data Science Technique

In the realm of data science techniques, the explosion of data has presented both opportunities and challenges. With the advent of big data, datasets are becoming increasingly complex and high-dimensional, posing significant computational and analytical hurdles. However, dimensionality reduction techniques offer a powerful solution to tackle these challenges, enabling data scientists to extract meaningful insights from large, intricate datasets efficiently.

Dimensionality reduction refers to the process of reducing the number of variables or features in a dataset while preserving its essential characteristics. By eliminating redundant or irrelevant features, dimensionality reduction techniques aim to simplify the dataset’s structure, making it more manageable and interpretable without sacrificing crucial information.

The data science techniques play a crucial role in various applications, including pattern recognition, classification, clustering, and visualization.

One of the most widely used dimensionality reduction in data science techniques is Principal Component Analysis (PCA). PCA seeks to transform high-dimensional data into a lower-dimensional space by identifying the principal components that capture the maximum variance in the dataset. Let’s delve into the implementation of PCA using Python to illustrate its effectiveness in reducing dimensionality.

Python

In this example, we applied PCA in data science technique to the Iris dataset—a classic benchmark dataset in machine learning. By reducing the dimensionality of the dataset from four features to two principal components, we were able to visualize the data in a two-dimensional space while preserving most of the original variance.

Another dimensionality reduction technique worth mentioning is t-distributed Stochastic Neighbor Embedding (t-SNE). Unlike PCA, which focuses on preserving global structure, t-SNE aims to preserve local structure, making it particularly useful for visualizing high-dimensional data in low-dimensional space. Let’s explore how to implement t-SNE using Python.

Python

In this example, we applied t-SNE to the same Iris dataset to visualize it in a two-dimensional space. The resulting plot highlights the clusters formed by different classes of iris flowers, demonstrating the effectiveness of t-SNE in capturing the underlying structure of high-dimensional data.Suppose we have a dataset containing gene expression profiles of tumor samples from breast cancer patients. Each sample in the dataset represents the expression levels of thousands of genes.

Our goal is to classify the tumor samples into different subtypes of breast cancer (e.g., luminal A, luminal B, HER2-enriched, basal-like) based on their gene expression profiles.We can use dimensionality reduction techniques, such as PCA, to extract the most informative features (genes) from the high-dimensional gene expression data and visualize the samples in a lower-dimensional space.Here’s how we can do it:

  1. Data Preprocessing: We preprocess the gene expression data by normalizing the expression levels and handling missing values if any. Dimensionality Reduction: We apply PCA to reduce the dimensionality of the data. PCA will identify the principal components (PCs) that capture the most variation in the data.

    Visualization: We visualize the samples in a two-dimensional or three-dimensional space using the first two or three principal components as axes. Each sample is represented as a point in the plot. Classification: We can then use machine learning algorithms, such as logistic regression or support vector machines, to classify the tumor samples based on their reduced-dimensional representation. Evaluation: We evaluate the performance of the classification model using metrics such as accuracy, precision, recall, and F1-score.

By visualizing the samples in a reduced-dimensional space, we can gain insights into the underlying structure of the data and potentially discover patterns or clusters corresponding to different subtypes of breast cancer. This can aid in both exploratory data analysis and building predictive models for cancer diagnosis and treatment.

Dimensionality reduction techniques like PCA and t-SNE offer invaluable insights into complex datasets, enabling data scientists to explore, analyze, and visualize high-dimensional data effectively.

By embracing these techniques, data scientists can uncover hidden patterns, reduce computational complexity, and make informed decisions based on a simplified representation of the data. As the volume and complexity of data continue to grow, dimensionality reduction techniques will remain indispensable tools in the data scientist’s toolkit, empowering them to navigate the intricacies of high-dimensional data analysis with confidence and precision.

Data Science

https://www.scholarnews.online

Data Science

Data Science Advance Tools – Series 1: Power of Time Series Analysis

Data Science

In the ever-evolving landscape of data science, one tool stands out for its unparalleled ability to uncover hidden patterns and predict future trends: time series analysis. This powerful technique allows us to harness the intrinsic value of temporal data, unlocking insights that can drive informed decision-making and strategic planning.

Time series analysis holds the key to understanding and harnessing the power of temporal data. By examining sequential data points collected over time, we can uncover underlying patterns, trends, and seasonality that may otherwise go unnoticed. From financial markets to meteorological forecasts, time series analysis offers invaluable insights into the dynamics of time-dependent phenomena.

One of the most widely used methods in time series analysis is the Autoregressive Integrated Moving Average (ARIMA) model. Let’s explore how we can implement ARIMA using Python to analyze and forecast time series data.

Python

By applying ARIMA to our time series data, we can generate forecasts and make informed decisions based on future trends. This empowers us to anticipate market fluctuations, optimize resource allocation, and mitigate risks effectively.

In conclusion, time series analysis is a potent tool in the arsenal of data scientists, enabling us to unravel the mysteries of temporal data and harness its predictive power. By leveraging techniques like ARIMA and embracing the wealth of insights they provide, we can unlock new opportunities and drive innovation in diverse fields ranging from finance to healthcare. Embrace the potential of time series analysis and unleash the power of data-driven decision-making.

Data Science

https://www.scholarhubedu.com

Clustering Technique

Easy Coding series 1: Depths of Clustering Techniques in Data Science

Clustering Techniques

Clustering Technique

In the boundless expanse of data science, clustering techniques emerge as enigmatic guides, leading us through the labyrinth of data with profound insight and emotional resonance. This article embarks on a poignant odyssey into their depths, illuminating their capacity to unveil hidden patterns and foster understanding.

Clustering techniques serve as beacons of discovery amidst the sea of data, offering solace and direction in the face of complexity. They are not merely algorithms but companions on our journey, guiding us through the murky depths of data with empathy and intuition.

As we immerse ourselves in their realm, we encounter a tapestry of techniques, each weaving a unique narrative of insight and revelation. From K-means clustering to hierarchical clustering, from DBSCAN to Gaussian mixture models, their diversity mirrors the rich tapestry of human experience, offering a myriad of perspectives on the data landscape.

Among these techniques, K-means clustering stands as a beacon of simplicity, dividing the data into cohesive clusters with elegant precision. Its iterative approach, fueled by the pursuit of cohesion and separation, resonates with our innate desire for order and structure amidst chaos.

Similarly, hierarchical clustering beckons us to explore the interconnected web of data, unveiling the nested relationships that lie beneath the surface. With each dendrogram, it reveals the evolutionary journey of data points, inviting us to witness the unfolding story of similarity and divergence.

Yet, amidst the complexity and intricacy of clustering techniques, there exists a profound sense of connection and belonging. As data points converge into clusters, we are reminded of the inherent unity that underlies diversity, and the profound interconnectedness of all things.

One example of clustering techniques in data science using health data is clustering patients based on their electronic health records (EHR) to identify distinct patient groups or cohorts with similar health characteristics.

Suppose we have a dataset containing EHR data of patients, including variables such as age, gender, medical history, vital signs (e.g., blood pressure, heart rate), laboratory test results, and diagnoses. Our goal is to cluster patients into groups based on their health profiles to uncover patterns and similarities within the patient population.

Here’s how we can approach it using clustering techniques:

  1. Data Preprocessing: We preprocess the EHR data by handling missing values, normalizing numerical variables, and encoding categorical variables if necessary.

  2. Feature Selection: We select relevant features from the EHR data that are informative for clustering patients. These features may include demographic information, clinical measurements, and diagnostic codes.

  3. Clustering Algorithm Selection: We choose an appropriate clustering algorithm based on the characteristics of the dataset and the objectives of the analysis. Commonly used clustering algorithms include K-means, hierarchical clustering, and DBSCAN.

  4. Clustering Analysis: We apply the selected clustering algorithm to the preprocessed EHR data to partition patients into clusters. Each cluster represents a group of patients who share similar health profiles.

  5. Cluster Interpretation: We interpret the clusters to understand the characteristics and health profiles of each group. This may involve examining the mean values or distributions of variables within each cluster and identifying common patterns or trends.

  6. Evaluation: We evaluate the quality of the clustering results using internal or external validation metrics, such as silhouette score or adjusted Rand index, if ground truth labels are available.

  7. Clinical Insights: We derive actionable insights from the clustering results to inform clinical decision-making and healthcare delivery. For example, we may identify high-risk patient clusters that require targeted interventions or personalized treatment strategies.

By applying clustering techniques to health data, we can uncover hidden structures and patterns within patient populations, leading to more tailored and effective healthcare interventions and ultimately improving patient outcomes.

In conclusion, clustering techniques offer more than just analytical insights; they offer a glimpse into the soul of data, revealing its hidden depths and stirring our emotions. Let us embrace their wisdom, cherish their insights, and navigate the complexities of data with empathy, intuition, and a sense of wonder.

https://www.scholarnews.online

Clustering Technique

Python
Classification Algorithm

Easy Analytics Series 1: Classification Algorithms in the Landscape of Data Science

Classification Algorithms

In the vast expanse of data science, classification algorithms stand as titans, shaping the contours of decision-making with remarkable precision. This article embarks on an emotional journey through their terrain, illuminating their capacity to categorize and predict outcomes with unparalleled accuracy.

Classification algorithms serve as the bedrock of predictive modeling, wielding transformative power in diverse domains. From healthcare to finance, from marketing to engineering, their impact reverberates through every facet of decision-making, offering clarity amidst the complexity of data.

As we delve into their realm, we encounter the elegant intricacies of algorithms such as Support Vector Machines (SVM), Decision Trees, and Random Forests. These algorithms, with their mathematical elegance and computational prowess, carve paths through the data landscape, discerning patterns and unraveling insights that elude the naked eye.

Among these algorithms, the Support Vector Machine (SVM) stands as a beacon of sophistication, harnessing the power of hyperplanes to delineate boundaries between classes with surgical precision. Its mathematical underpinnings, rooted in convex optimization and kernel methods, imbue it with a formidable ability to generalize from sparse data and adapt to complex decision boundaries.

Similarly, Decision Trees weave a narrative of decision-making, branching out into a maze of possibilities to uncover the optimal path forward. With each split, these trees partition the feature space, distilling the essence of data into a hierarchy of choices that lead to informed decisions and actionable insights.

In the forest of algorithms, Random Forests emerge as a collective force, harnessing the wisdom of crowds to amplify predictive performance. By aggregating the predictions of multiple decision trees, they mitigate the risk of overfitting and enhance the robustness of classification models, empowering decision-makers with reliable predictions and insights.

https://pivotssl.com/?p=16

Yet, amidst the mathematical elegance and computational sophistication, classification algorithms remain more than mere tools; they are catalysts for change, empowering organizations to make informed decisions, drive innovation, and shape the future.

In conclusion, the impact of classification algorithms transcends the boundaries of data science, leaving an indelible mark on the landscape of decision-making. Let us embrace their transformative power, harness their predictive prowess, and navigate the complexities of data with confidence and clarity.

https://scholarnews.online

Clustering Technique
Python

New Info: Power of Regression Analysis in Data Science

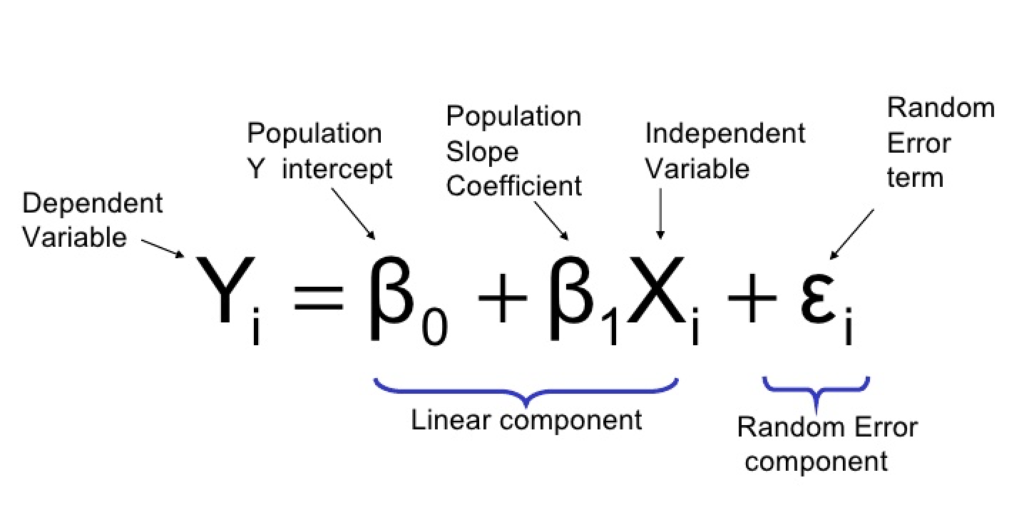
In the vast realm of data science, there exists a silent hero, a stalwart amidst the chaos – regression analysis. This article embarks on an emotional journey into the heart of regression analysis, revealing its unwavering dominance and unparalleled prowess in deciphering the intricate tapestry of data.

Regression analysis emerges as a beacon of hope amidst the labyrinth of variables, shedding light on the hidden connections that lie beneath the surface. It is not merely a statistical tool but a guardian of truth, guiding us through the tangled web of data with steadfast determination.

As we delve deeper into its realm, we uncover the profound impact of regression analysis across various domains. From finance to healthcare, from marketing to engineering, its predictive power knows no bounds. With each analysis, it paints a vivid picture of the future, offering insights that defy expectations and defy uncertainty.

But regression analysis is more than just a predictive tool; it is a source of comfort in a world of uncertainty. In the face of chaos and confusion, it provides clarity and direction, empowering us to make informed decisions and chart our course with confidence.

Yet, amidst its dominance, regression analysis remains humble, quietly working behind the scenes to unravel the mysteries of data. It is a silent hero, a guardian of truth, and a beacon of hope in an ever-changing world.

In conclusion, regression analysis stands as a testament to the power of data science – a force to be reckoned with, an ally in our quest for knowledge, and a beacon of hope in our journey towards understanding. Let us embrace its dominance, unleash its power, and harness its potential to transform the world around us.

In conclusion, regression analysis stands as a testament to the resilience of data science – a force of nature, a companion in our quest for understanding, and a beacon of hope in our pursuit of knowledge. Let us embrace its essence, cherish its wisdom, and harness its power to illuminate the path forward.